Liability Hedge Fixed Income Solutions created using Factor Sensitivity Matching are based on the fundamental notion that interest rate term structure can be decomposed into the underlying Factors and a portfolio of bonds can be chosen such that its sensitivity to changes in such Factors is the same as the sensitivity of pension liability to changes in these Factors. One of the statistical techniques used to extract the underlying Factors from the interest rate term structure is Principal Component Analysis.
Estimation of Factors
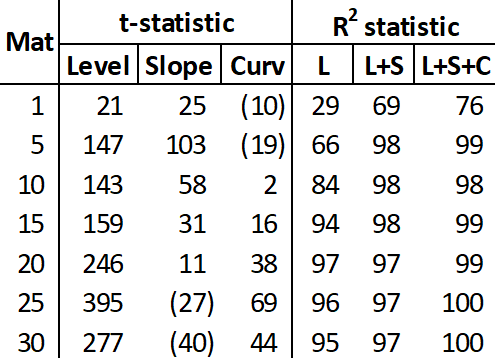
Initially, these Factors are not known, since they are not observable in the market place, i.e. they are not tradable Factors, but it is assumed that they represent linear combinations of the underlying spot rates of the interest rate term structure. Principal Component Analysis is a statistical technique used to identify and evaluate Factors by maximizing their co-variability with the underlying interest rates.
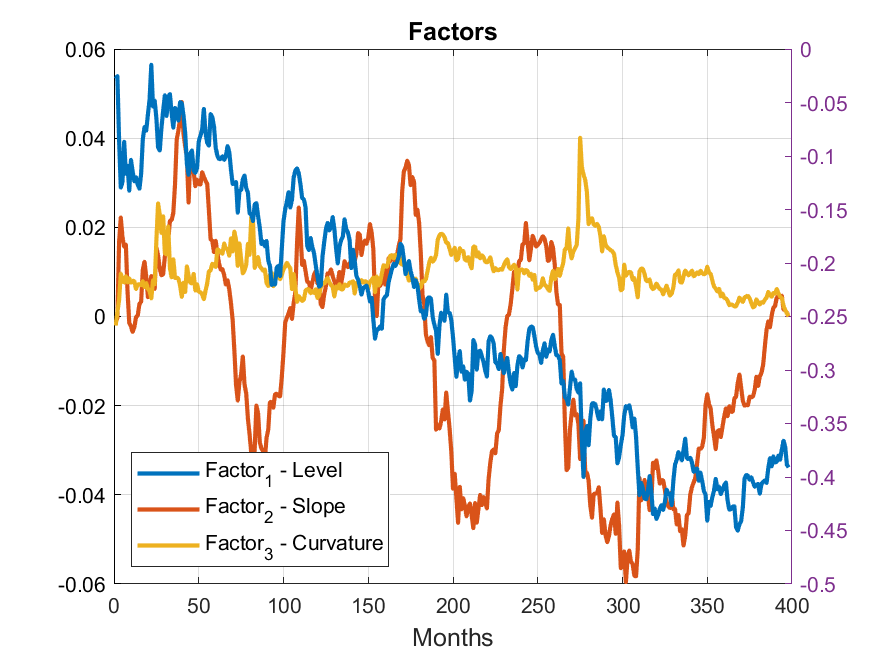
Time Series of Factors
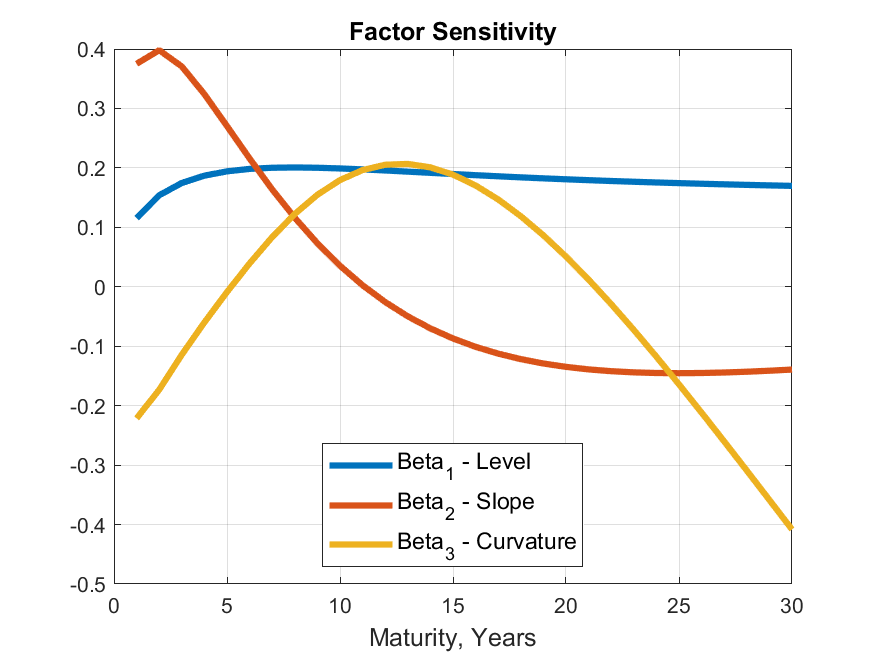
Economic Interpretation of Factors
Therefore, when it comes to Principal Component Factors representing interest rate term structure, the most appropriate way to interpret Factors is to look at and examine sensitivities of the underlying interest rate term structure to such Factors as shown on the following chart:
Factor Sensitivity Match vs Other Strategies: Efficient Frontier
Benefits of Factor Sensitivity Matching strategy are better understood and appreciated when its results are compared to those of other strategies. The following chart presents a plot of Risk and Return for several Liability Hedge strategies, such as Duration Matching, Duration/Convexity Matching, Key Rate Duration Matching, and Full Cash Flow Matching as compared to Factor Sensitivity Matching strategy. Risk and Return on the Efficient Frontier are based on pension plan’s Funded Status (Liability minus Bond portfolio invested in a given strategy), where Risk is measured as the expected downside of Funded Status in the worst 5% scenarios, and Return is measured as the expected level of Funded Status. Efficient Frontier is interpreted as follows:
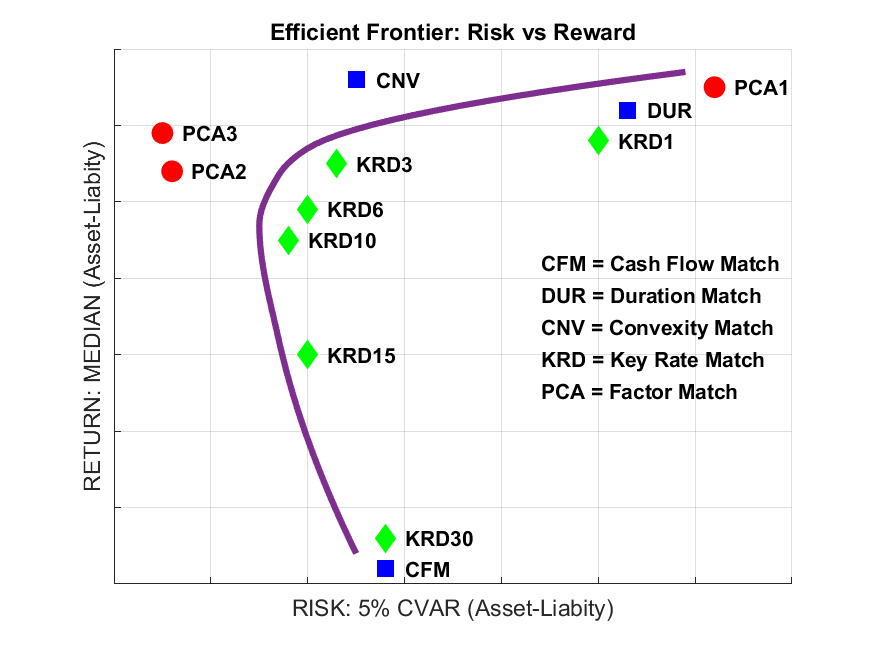
Superiority of the Factor Sensitivity Matching Strategies is shown by the fact that these strategies are located off the Efficient Frontier in the upper-left corner. This position implies that as compared to other matching strategies, Factor Sensitivity Matching provides greater Return for the same level of Risk or smaller Risk for the same level of Return.
Factor Sensitivity Match vs Other Strategies: Stochastic Projections
Another way to see superiority of Factor Sensitivity Matching Strategies as compared to other strategies is to look at the stochastic projections of Funded Status over time based for all strategies and compare them to each other. The results are presented in the following chart:
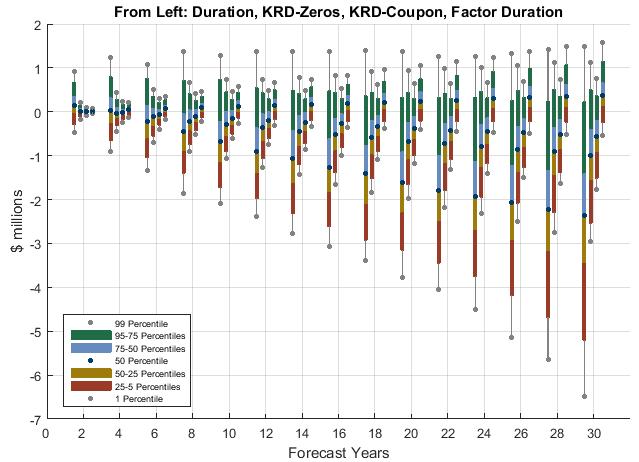
In general, Factor Sensitivity Matching Strategy provides asset-liability mismatch protection equivalent to 10-15 Key Rate buckets, but using much fewer bonds, since it is a much less restrictive strategy, leading to superior Risk and Return measures.
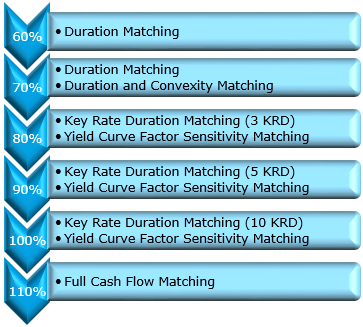
Sequential De-Risking Solutions
Since various Liability Hedge strategies have very different Risk and Return profiles, they can be deployed sequentially under different circumstances or triggers, and packaged as part of Sequential De-Risking Solutions as follows:
As pension plans’ funding levels improved over time and many pension plans embarked on the de-risking path, Liability Hedge asset class became one of the most dominant asset classes in many pension portfolios, requiring much greater attention and sophistication. Given the recent advances in the fixed income quantitative research, a Liability Hedge strategy based on hedging liability’s sensitivity to Factors embedded in the interest rate term structure proved to provide superior Risk/Return characteristics as compared to the traditional strategies. Such Factor Sensitivity Matching strategies effectively hedge against non-parallel yield curve shifts as 10-15 Key Rate buckets would but with much fewer bonds leading to greater cost efficiency and greater protection of asset-liability matching.