Optimized Glidepath: Direct Result of Stochastic Optimization
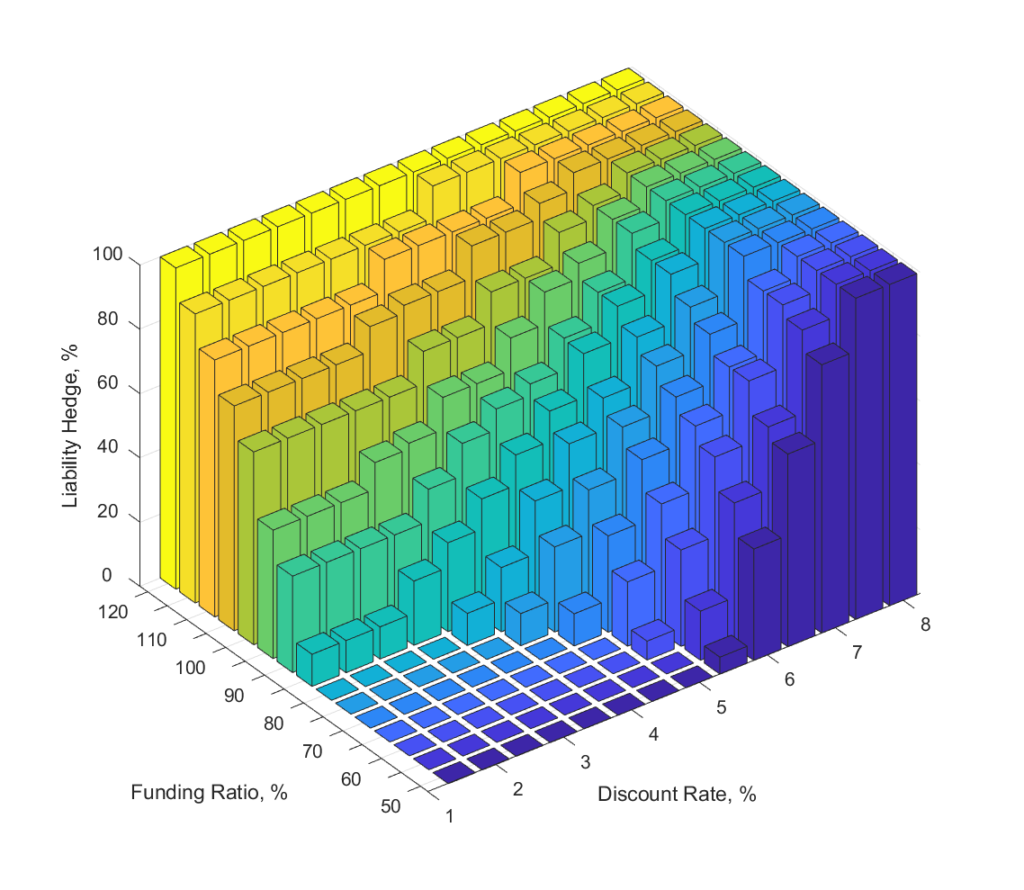
Optimized multi-trigger Glidepath is the direct result of stochastic portfolio optimizations solved via Dynamic programming methods:
Conditional on Funding Ratio and Discount Rate levels at each point of time, portfolio is optimized by running ALM Studies for each such conditional level from the chosen grid.
Once the entire Dynamic optimization is completed by carrying out the backward induction-type Dynamic portfolio optimization, optimal allocation is determined for each future point of time and for each Funding Ratio and Discount Rate level found in the implemented grid.
Such Conditional levels of Funding Ratios and Discount Rates will serve as natural triggers to execute Dynamic Asset Allocation strategy (Glidepath) in real time until the end of investment horizon or until a new re-optimized Glidepath is determined.
Stochastic Efficient Frontier
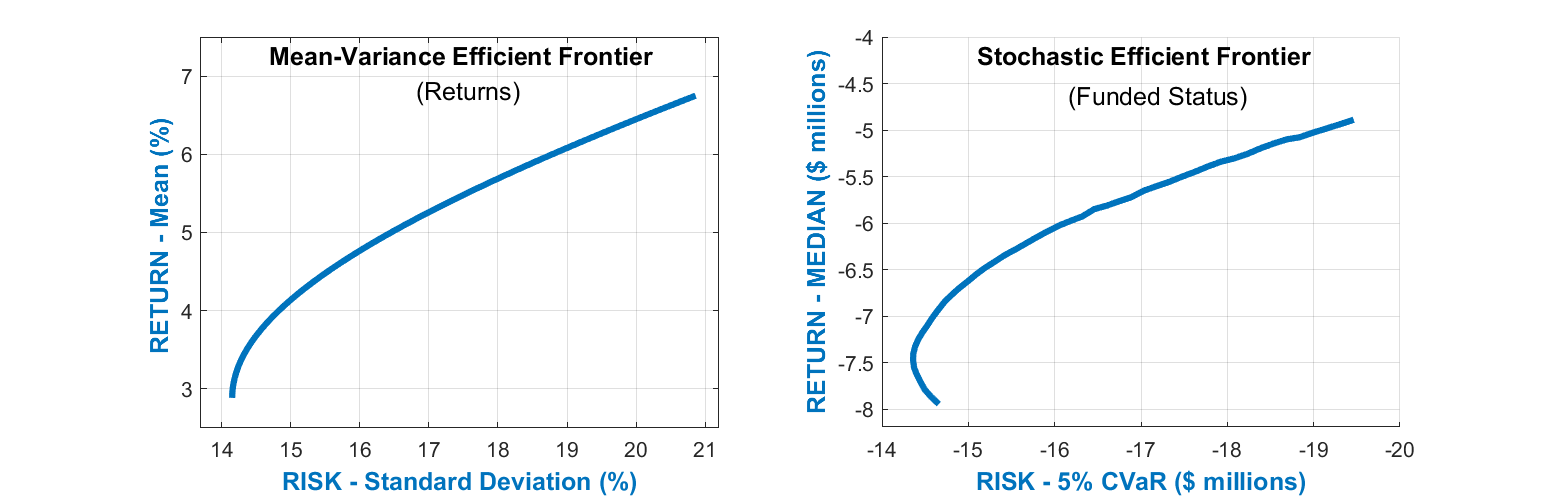
Stochastic Efficient Frontier is a very effective way to analyze simulated results of ALM Studies in order to compare impacts of various investment strategies. Just like Traditional Efficient Frontier, Stochastic Efficient Frontier depicts investment strategies based on their respective Risk and Return levels. However, Traditional and Stochastic Efficient Frontiers define Risk and Return differently as shown in the following table:
Mean-Variance Type Optimization
Stochastic Optimization
Risk Measure
Standard Deviation of asset returns
Downside level of Funded Status
Return Measure
Expectation of asset returns
Median level of Funded Status
Dynamic vs Static: Stochastic Efficient Frontier
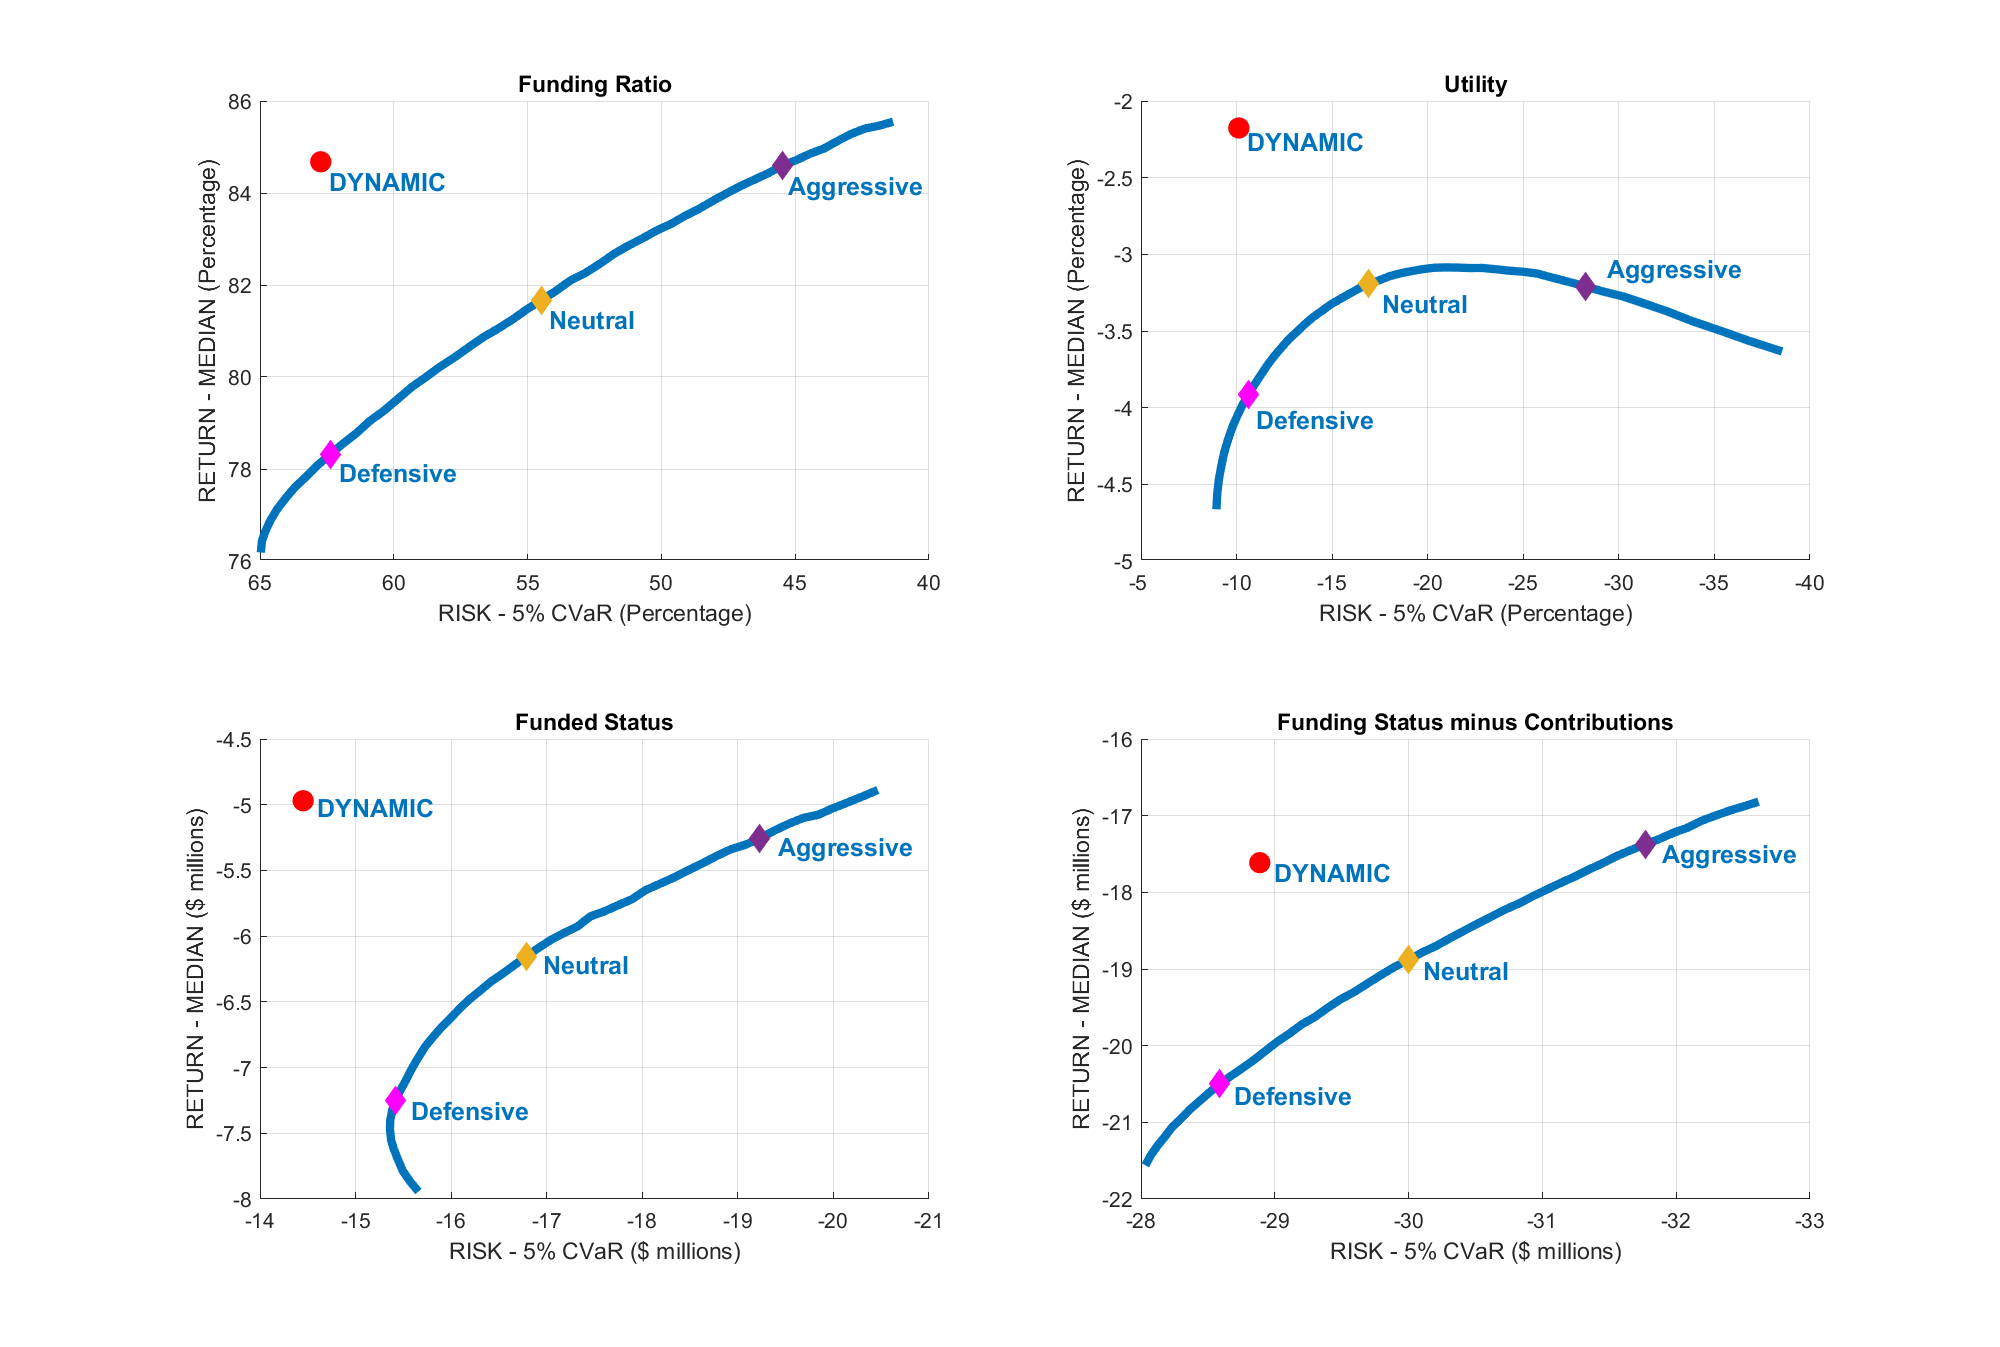
Stochastic Efficient Frontiers are used in order to compare Dynamic Asset Allocation Strategy and Strategies which are Static in nature, based on four different metrics: Funding Ratio, Funded Status, Utility Function, and Funded Status reduced by Accumulated Contributions:
Dynamic Strategy is More Efficient
According to the following charts, Dynamic strategy is more efficient than all Static strategies, since Dynamic strategy lies above Efficient Frontier and offers higher Return for the same Risk and lower Risk for the same Return as compared to all Static strategies.
Dynamic is Superior by Custom Design
Dynamic strategy is better by design as it explicitly reflects each pension plan specific multi-period horizon, assets and liabilities, all cash inflows and benefit payment outflows, while Static strategies do not reflect any such pension plan specific items.
All Efficient Frontiers Show Similar Results
Similar results are observed in all four Efficient Frontiers as shown in the following charts, i.e. all four different Efficient Frontiers lead to the same conclusion that Dynamic strategy provides more superior Risk-Return trade off as compared to all Static strategies.
Dynamic vs Static: Simulations
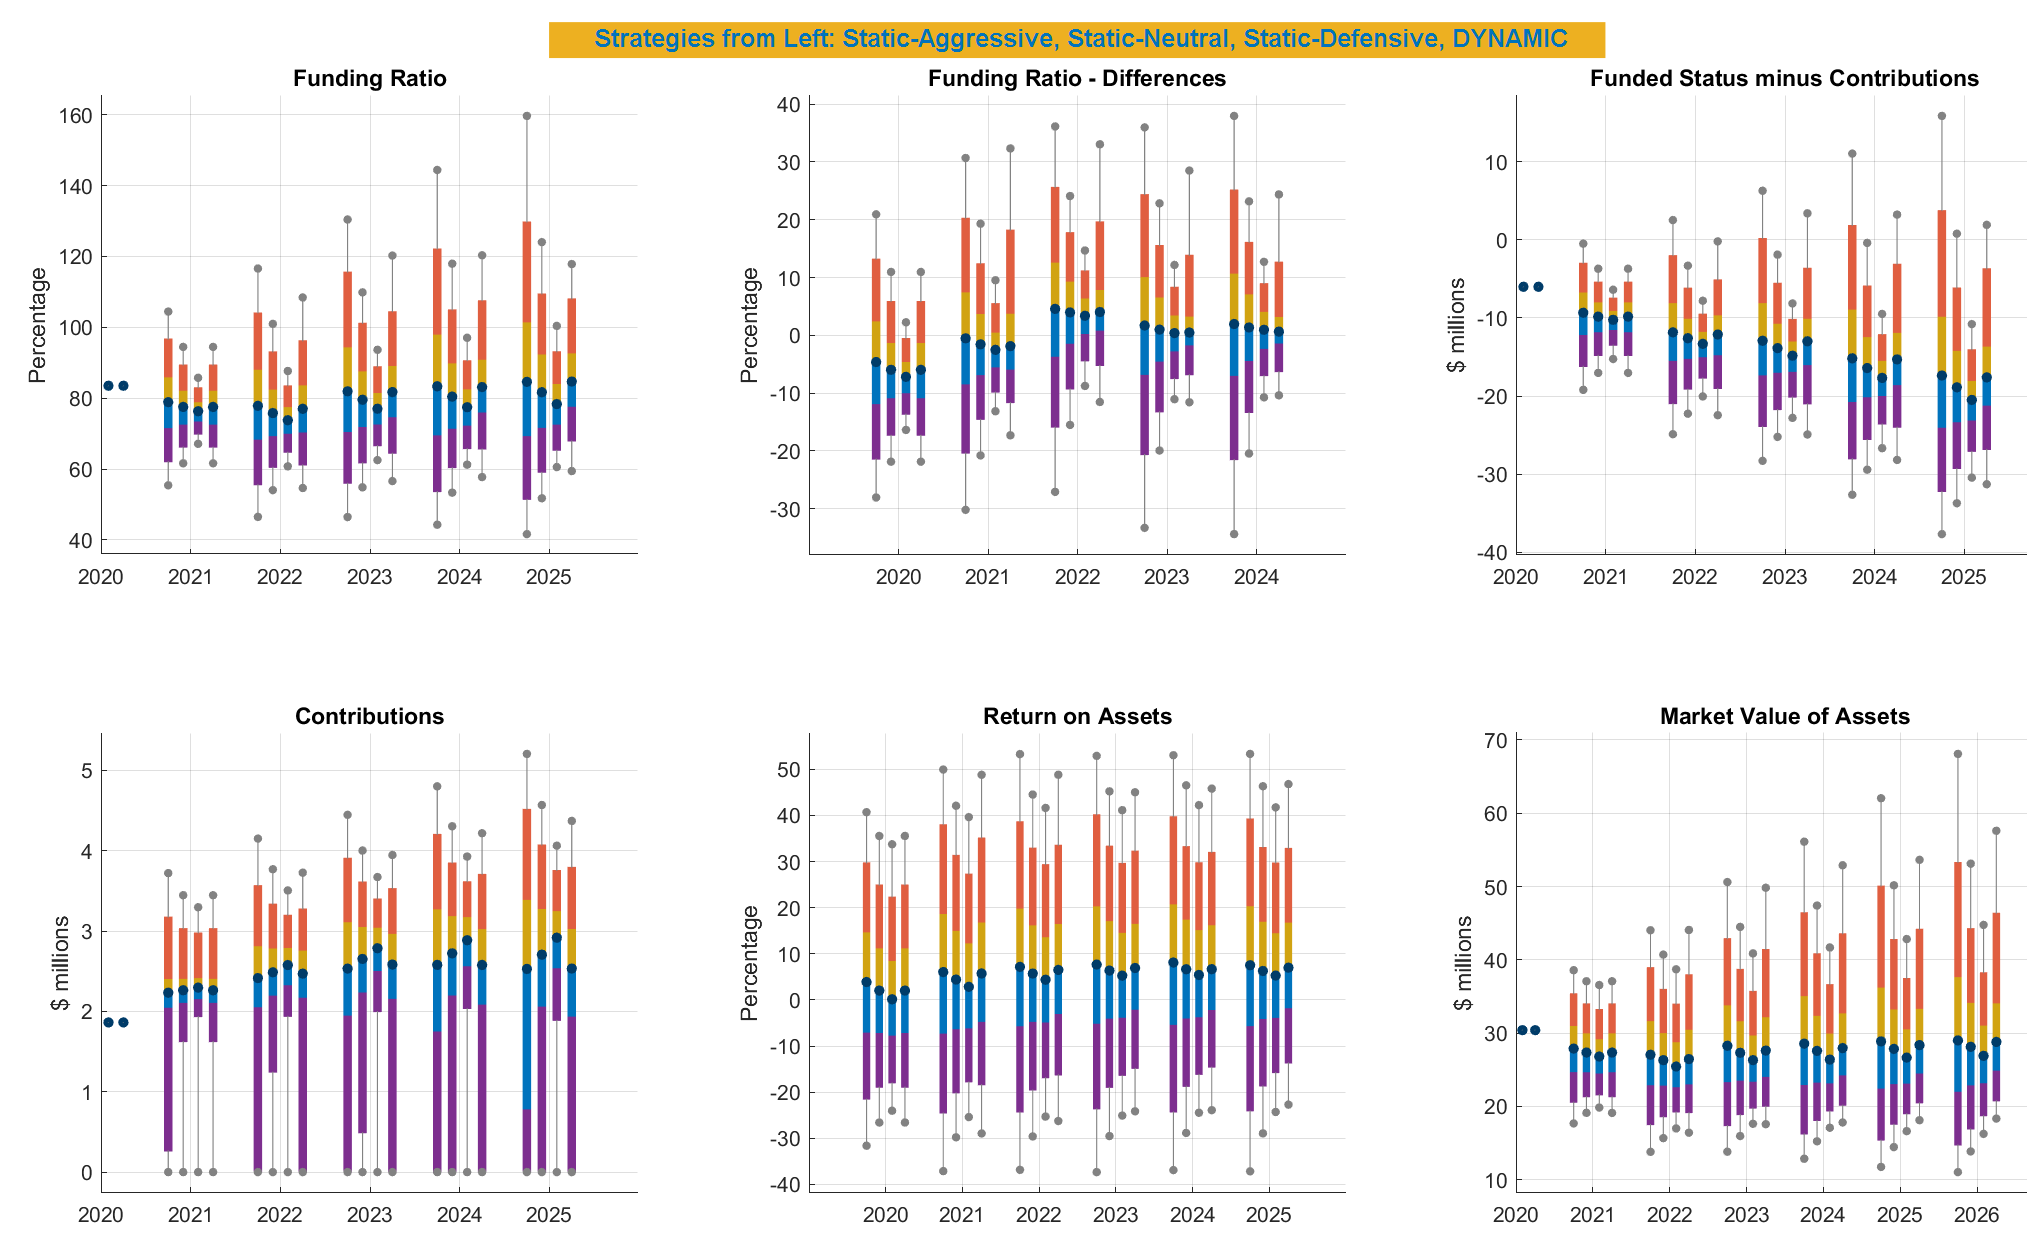
Performance of Dynamic Strategies can also be compared to performance of Static strategies by utilizing stochastic simulation charts:
Funding Ratio
Dynamic strategy shows higher expected Funding Ratios (mid-point) and better downside risk of Funding Ratios (lower parts).
Funding Ratio Differences
Dynamic strategy shows the range of changes in Funding Ratios comparable to Static-Defensive strategy, while providing much greater upside potential than Static-Defensive strategy.
Funded Status minus Contributions
Dynamic strategy shows higher expected Funded Status reduced by Contributions (mid-point) and better downside risk of Funded Status reduced by Contributions (lower parts).
Contributions
Dynamic strategy shows lower expected Contributions (mid-point) and better downside risk of Contributions (lower part).
Return on Assets
Dynamic strategy shows higher expected Return on Assets (mid-point) and better downside risk of Return on Assets (lower parts).
Market Value of Assets
Dynamic strategy shows higher expected Market Value of Assets (mid-point) and better downside risk of Market Value of Assets (lower parts).
Benefits of Optimized Multi-Trigger Glidepath
Attractive Risk/Return Trade Off
As shown in the charts above, optimized Glidepath can provide attractive Risk/Return trade offs due to disciplined rebalancing driven by the triggers and due to reliance on the empirically proven and effective Predictive Factors.
Fully Customized
Optimized Glidepath fully reflects each client’s unique liability profiles, funding requirements, assets and liabilities, cash contribution inflows and benefit payment outflows, required horizon, and any other unique objectives and constraints.
Custom Rebalancing Triggers
Substantial variety of custom rebalancing triggers can be applied to each pension plan’s unique liability structures based on their unique de-risking objectives and constraints, which is especially the case when Predictive Factors are implemented.
Fully Integrated with Liability Hedges
Optimized Glidepath is integrated with Liability Hedge Fixed Income Solutions to a very large degree, where Funding Ratio and Discount Rate based Glidepath triggers can also drive rebalancing of Liability Hedge Solutions.
Integrated with Factor-Based Liability Hedges
Optimized Glidepath is even better integrated with Factor-Based Liability Hedge Fixed Income Solutions, where common Factors, such as yield curve’s Level, Slope and Curvature, can be the basis for Factor-Based Liability Hedges and can also serve as rebalancing triggers for Glidepath.